High-Probability Trade Setups: Most Reliable Technical Patterns
Identifying high-probability trade entries and exits starts with recognizing reliable technical patterns. Below are some of the most time-tested setups used by professional traders across markets:
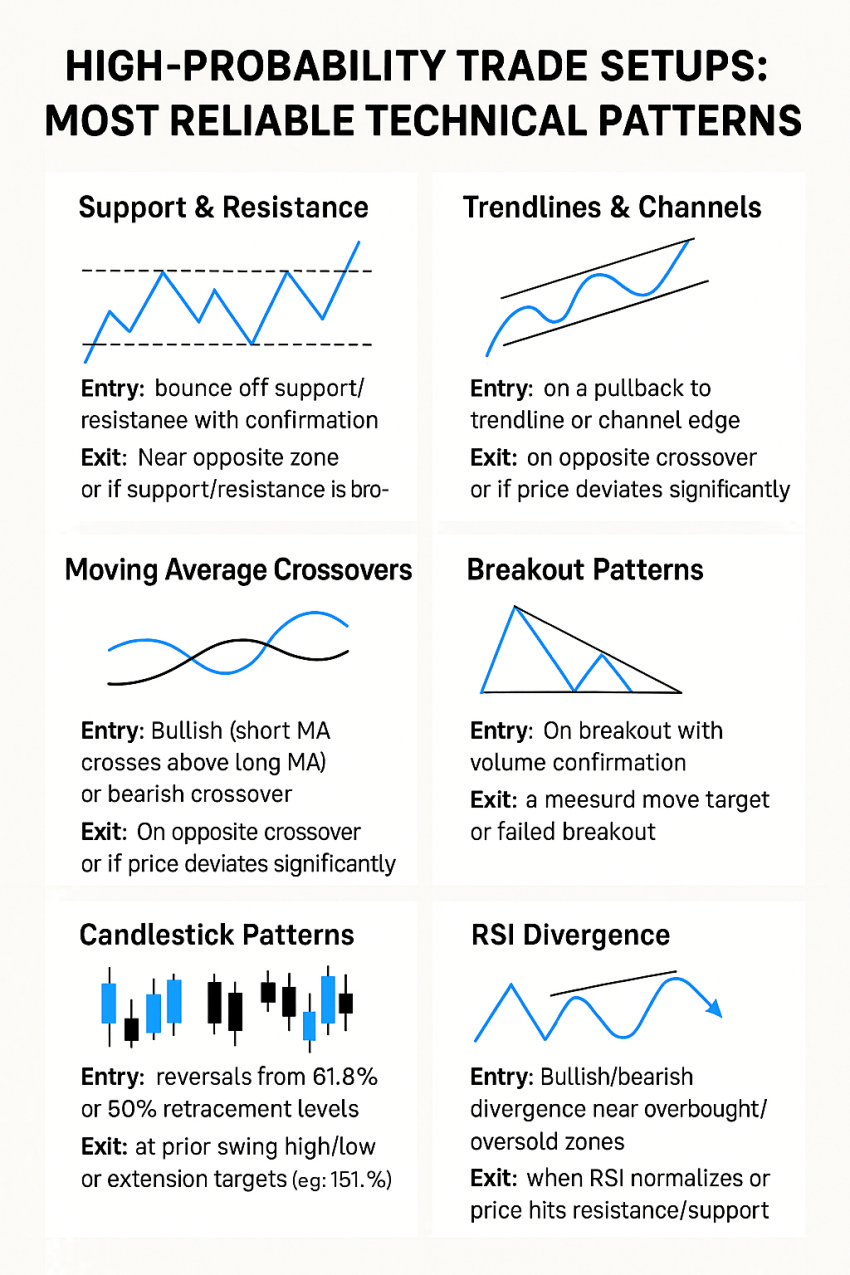
1. Support & Resistance
- Entry: When price bounces off a key support or resistance level with confirmation from a candlestick signal.
- Exit: Near the opposite zone or upon a confirmed break of the level.
2. Trendlines & Channels
- Entry: On a pullback to a trendline or edge of a channel.
- Exit: At the opposite side of the channel or on a trendline break.
3. Moving Average Crossovers
- Entry: When a short-term moving average crosses above (bullish) or below (bearish) a longer-term moving average.
- Exit: On the opposite crossover or when price moves too far from the average.
4. Breakout Patterns
- Examples: Triangles, flags, and rectangles.
- Entry: On breakout with volume confirmation.
- Exit: At a measured move target or if the breakout fails.
5. Candlestick Patterns
- Reliable Setups: Bullish/bearish engulfing, pin bars, morning/evening stars.
- Entry: When formed at key support/resistance or trend reversal zones.
- Exit: On the next significant pattern or pre-set profit target.
6. Fibonacci Retracement
- Entry: On price reversals from 50% or 61.8% retracement levels.
- Exit: At prior swing highs/lows or Fibonacci extension levels (e.g., 161.8%).
7. RSI Divergence
- Entry: When price diverges from RSI near overbought or oversold territory.
- Exit: When RSI re-aligns with price or at key support/resistance levels.
Pro Tip: Combine these patterns with volume analysis and higher time frame context for added conviction. Reliability increases when multiple signals align.