The Psychology Behind the Hammer Candlestick Pattern
In technical analysis, candlestick patterns reveal more than just price action—they tell stories about market psychology. One of the most powerful single-candle patterns is the Hammer, a bullish signal that marks a potential reversal at the end of a downtrend. But its true strength lies not just in its appearance—but in the emotional battle it reflects.
What Is a Hammer Candlestick?
A hammer candlestick forms when:
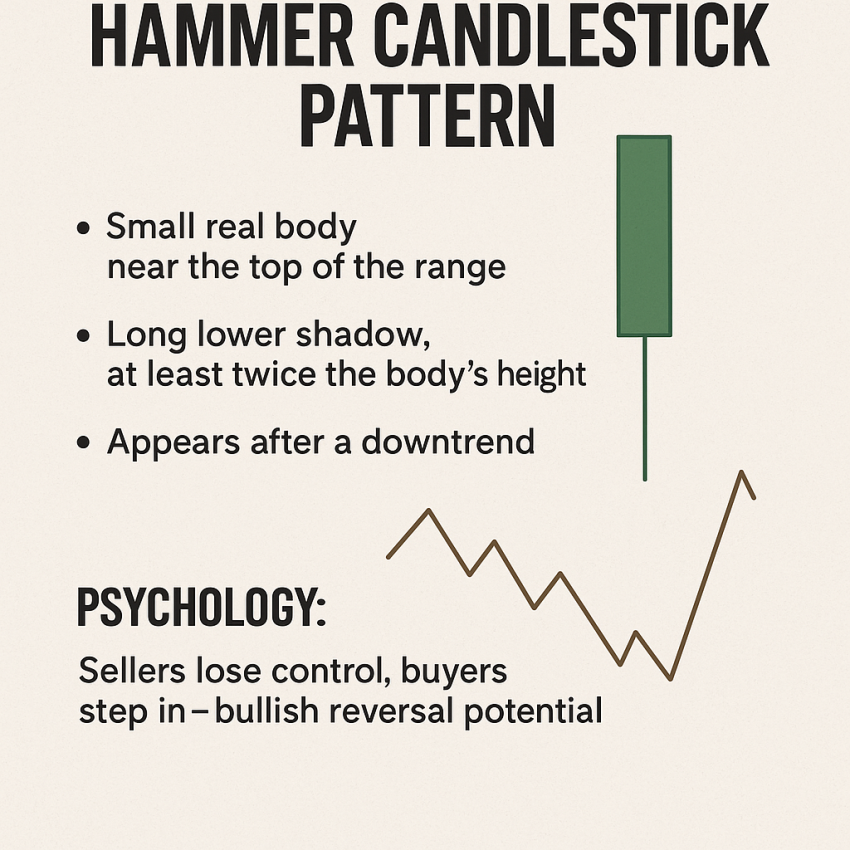
- The real body (the open and close) is small and near the top of the candle,
- There’s a long lower shadow, at least twice the size of the real body,
- And there’s little or no upper shadow.
This structure gives the candle its iconic “hammer” shape—like a handle with a long wick beneath.
Where It Appears Matters
The hammer only carries bullish implications when it appears after a downtrend. Context is key. When spotted at a support level or the bottom of a falling market, it signals a potential shift from selling to buying pressure.

The Psychology Behind the Pattern
Here’s what’s really happening behind the scenes when a hammer forms:
- Initial Fear: Sellers dominate early in the session, pushing the price significantly lower.
- Buyer Strength Emerges: Rather than collapsing, the price stabilizes—and buyers begin to step in.
- Reversal in Sentiment: By the close, bulls reclaim control and drive the price back near or above the open.
This transformation captures a psychological reversal: what started as a session filled with panic ends with renewed optimism. The long lower wick represents rejected lows, and the small body shows the buyers’ resilience.
How Traders Use the Hammer
1. Wait for Confirmation
Smart traders never rely on a single candle. A hammer is more reliable when followed by a bullish candle that closes above its high. This confirms buyer momentum.
2. Entry and Risk Management
- Entry: Above the hammer’s high or the next candle’s open
- Stop-loss: Just below the hammer’s low, in case selling resumes
3. Use with Other Tools
Combine hammers with:
- Support levels or trendlines
- Volume spikes
- RSI divergences or oversold conditions
Summary
| Attribute | Insight |
|---|---|
| Shape | Small body near top, long lower shadow |
| Location | Must appear after a downtrend |
| Psychology | Sellers lose control, buyers step in—bullish reversal potential |
| Confirmation | Stronger when followed by bullish candle & confluence with support |
Final Thought
The hammer candlestick is more than a shape—it’s a moment where fear is tested and strength is revealed. It reminds traders to pay attention to shifts in momentum and to look beyond price into the psychological battle happening behind the charts.